As the EPFL Mass Spectrometry facility, we have developed over years multiple versatile and free Online Mass Spectrometry Tools for many different analytes such as small molecules, proteins and oligonucleotides. The open access EPFL MStoolbox is a compilation of all these tools that allow the analysis of High Resolution Mass Spectra directly from your web browser. This webpage provides guidelines and explanations for each tool and is targeted for both beginners and advanced MS users. The EPFL MStoolbox could be particularly useful for anyone working in the field of Mass Spectrometry but does not have access to commercial software for the data treatment. The use of any of our applications is totally free, but sharing and citing it is highly appreciated. If you want to be updatedd, follow us in twitter or linkedln.

Theoretical calculations
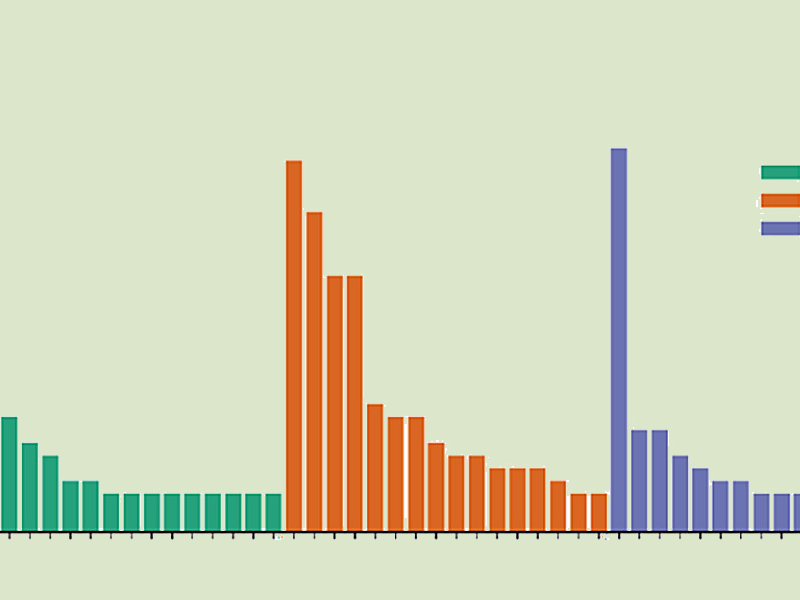
Online Mass Spectrometry Tools to generate theoretical isotopic distributions, find a molecular formula from an experimental value or calculate MS/MS fragments from a given structure.
Details
Complex mixtures of compounds
Use our Soup of Peaks to identify and find any molecular formula in your experimental data.
Details
MSPolyCalc for polymers
Facilitates structural characterization of polymers, ionization adducts identification and end-group determination together with visual reporting.
Details
Custom Database / Contaminants
Create your own database and track each molecule with any adduct in your experimental dataset. Track your background ions with easycont
Details
Apm2s for peptides & proteins
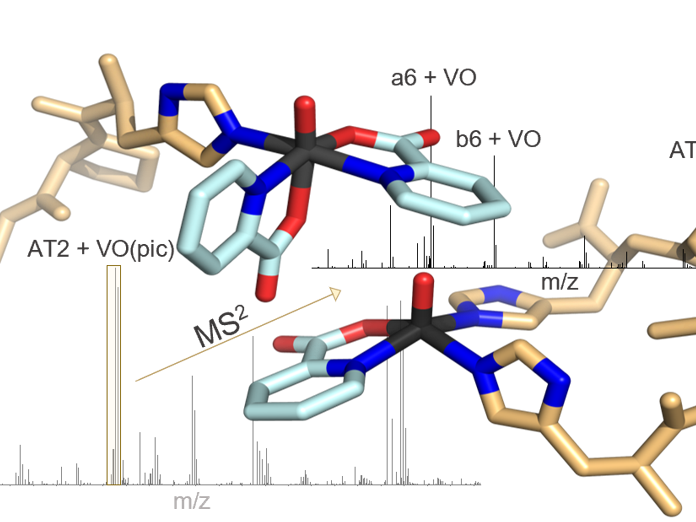
Assign in your experimental MS and MS/MS spectra any possible peak, adduct or fragment from a user-defined peptidic sequence. Generates list of assigned fragments and fragment maps.
Details
Aom2s for oligonucleotides
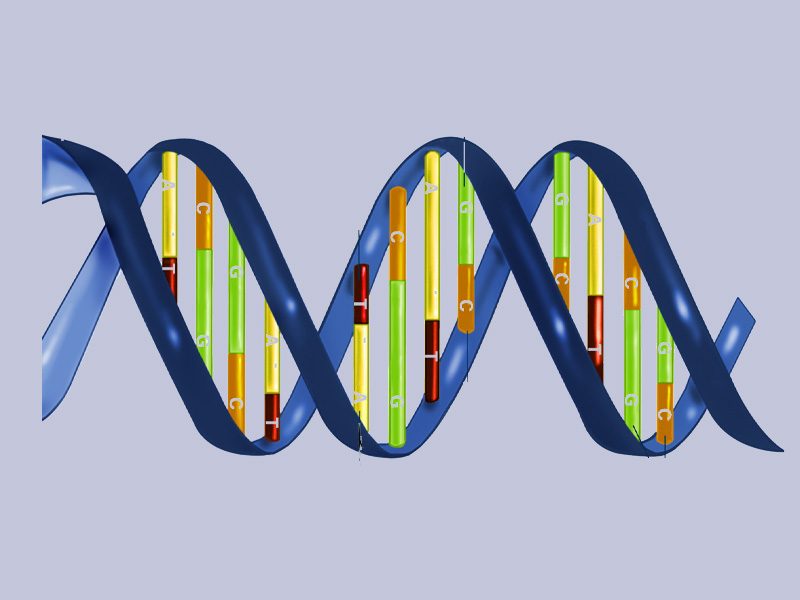
Assign in your experimental MS and MS/MS spectra any possible peak, adduct or fragment from a user-defined DNA/RNA sequence. Generates as a result a list of assigned fragments and fragment maps.
Details
Mass Spectra deconvolution
This tool allows to determine the exact compoistion based on a mass spectrum when overlapping occurs
Details
GC/LC-MS visualization
This tool allows visualizing chromatograms generated using GC-LC-Ms Techniques
Details


