[ultimate_heading main_heading=”Web-based application for advanced data analysis of complex samples” main_heading_margin=”margin-bottom:10px;” main_heading_style=”font-weight:bold;” main_heading_font_size=”desktop:50px;” main_heading_line_height=”desktop:60px;”]Mixture is a powerful application for complex data treatment. You specify atoms or groups of atoms that, when combined, generate multiple combinations (up to millions) that will be matched and compared with your experimental spectra. The system allows as well to specify the polarity, number of charges or different adducts, The experimental mass spectrum can be then screened in a few seconds. Soup of peaks browses the results ordered by similarity (%) and gives information about each identified molecule in a simple way. Soup of peaks can be used for any kind of chemical system such as sugars, ionic liquids or metal-coordination cages. All the calculations applied during data treatment are performed locally in the browser, with no data transferred to the servers.[/ultimate_heading]
app-7
Calculate the molecular formula and the isotopic distribution of any kind of molecule. Go to the ``small molecule`` applications.
Details
app-12
Advanced analysis for mixture of compounds, with automatic peak picking and ion assignment and as a result a clear graphical representation.
Details
app-index-app2
Find other open access applications for data treatment.
Details
[ultimate_heading main_heading=”How to use Soup of Peaks step by step” main_heading_margin=”margin-bottom:10px;” main_heading_style=”font-weight:bold;” main_heading_font_size=”desktop:50px;” main_heading_line_height=”desktop:60px;”]Check related concepts in our glossary[/ultimate_heading]

STEP 1

Importing Experimental data

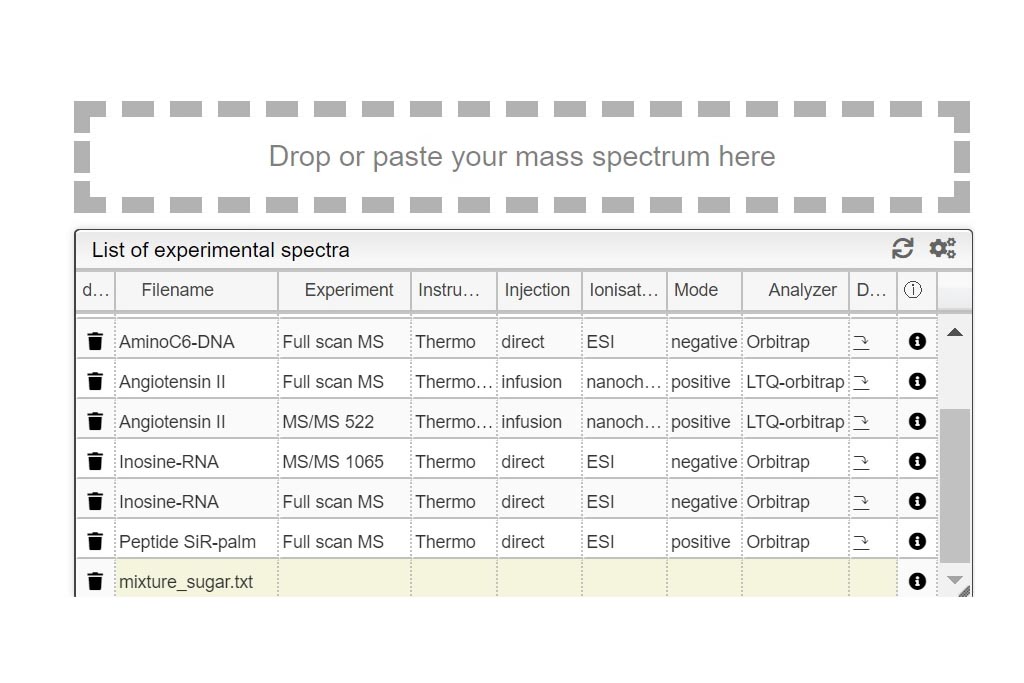
This tool can be either used in a LIMS or stand-alone. In the stand-alone mode you should either drag/drop your experimental spectrum as a tab-delimited text file or copy paste it (CTRL-V) while moving you mouse over the drop zone. The list of available mass spectra will be displayed in the table and you can simply click on one of them to display it.

STEP 2 (Automatic)

Automatic Peak Picking

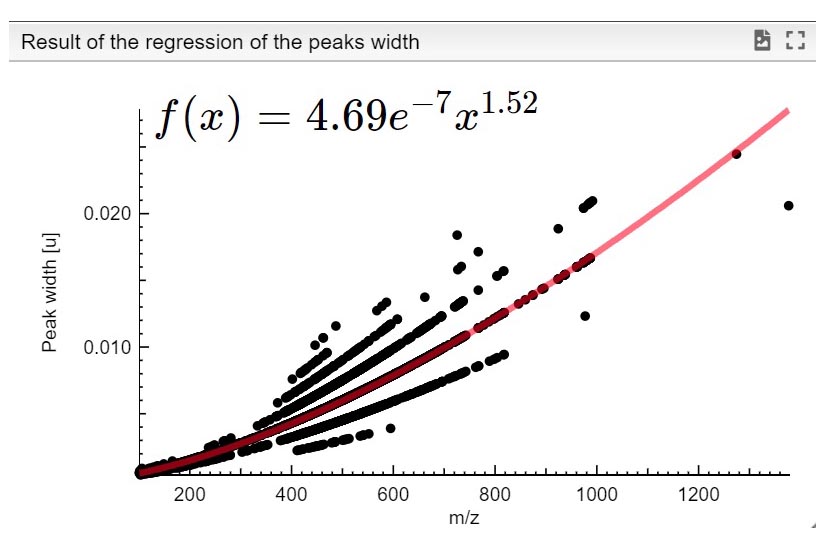
Once the experimental spectrum is uploaded, mixture automatically triggers peak picking and generates a list of experimental monoisotopic centroids. For fine-tuning of calculations, the resolution as a function of the m/z is automatically plotted and the corresponding regression curve used to adjust the peak width. Both calculations can be viewed in the Peak Picking Module. The data showed in the right represent the resolution (peak width) vs m/z in our Orbitrap Elite for the MS of inosine RNA example available from the List of experimental spectra.

STEP 3

Molecular Formula range selection and description

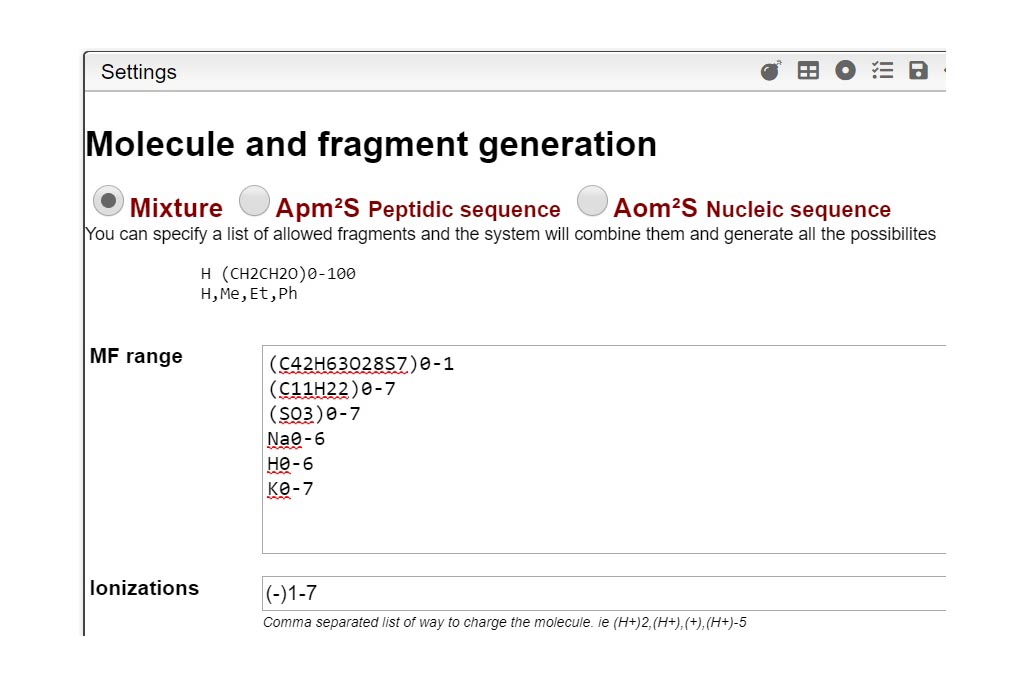
This step is critical for a good mixture calculation. You need to define all possible “pieces” that you want to find in your experiment. Like in a puzzle, the solver is expected to put pieces together in a logical way. Let’s think about the sugar examples shown here, where one lipophilic central core should be present but you want to probe also for absence, written (C42H63O28S7)0-1). This core tends to bind between 0-7 chains (C11H22SO3) in our case. During the experiment, some labile SO3 groups may have been lost during ionization so  the chain could be split in two (C11H22)0-7 and (SO3)0-7. Each of the sulfate group is negatively charged so you should specify it by indicating it this way [-1- -7]. Additionally, the molecule could also by cationized with H,Na or K positively charged. Mixture will combine all these possibilities and  generate their corresponding molecular formulas. Finally mixture will subsequently try to matched theoretical to the experimental spectra. The list of all abbreviations that can be used to indicate the common functional groups is found at the top right corner of the Settings window.

STEP 4

Molecular Formula filtering

You can filter the obtained molecular formula in step 5 by different criteria such as the charge, the experimental m/z or the unsaturation. This option was not selected for any of our examples in the list of experimental spectra.

STEP 5

Select the Matching Threshold

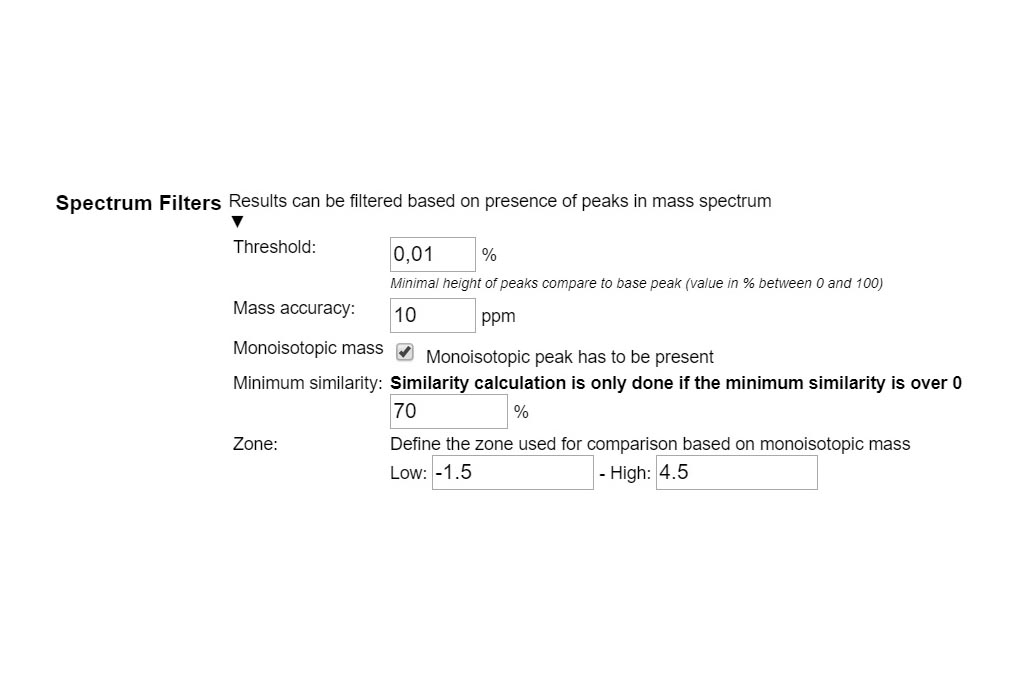
In order to improve the isotopic profile matching between theoretical and experimental data, a few spectrum filters should be properly set here. First you should set the experimental relative peak intensity threshold (typically between 0.01-0.1). Second, the authorized experimental mass error in ppm (typically <5 ppm for Orbitrap mass analyzer) and third, the minimum similarity for peak matching should be set (typically between 70-80%). Check how mixture calculates Similarity here. Lastly, you should decide if the monoisotopic mass has to be present in the spectrum (which depends on the size of the compound) and set the comparison zone which should be adjusted based on the complexity of the expected isotopic pattern.

Step 6 (Optional)

Post-calibration

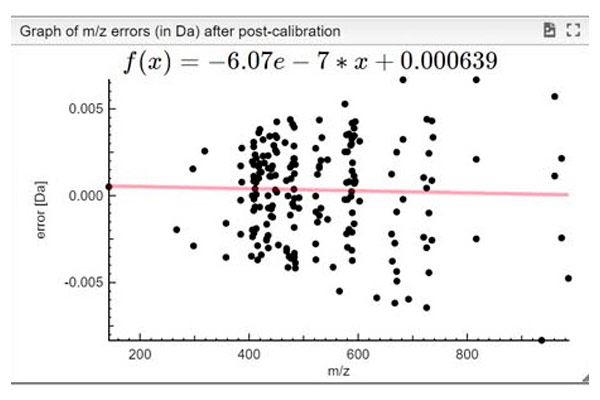
Once the initial calculation is over, mixture allows you an additional post calibration step to improve mass accuracy and, therefore, similarity scores of matched ions. In order to recalibrate the data, you need first to precise the minimum number of reference peaks with a defined minimum similarity to be taken in the peak picking and recalibration module. Once defined, you click the calibrate and recalculate button and mixture reprocess the data in a few seconds. You can view the graph of errors (in Da and ppm) between found and expected after corrections and other details in the Peak picking and recalibration module at the top. Displayed graph of errors corresponds here tor our mixture-sugar example.

[ultimate_heading main_heading_margin=”margin-bottom:10px;” main_heading_style=”font-weight:bold;” main_heading_font_size=”desktop:35px;” main_heading_line_height=”desktop:60px;”][/ultimate_heading]

Resuts 1

List of fragments view

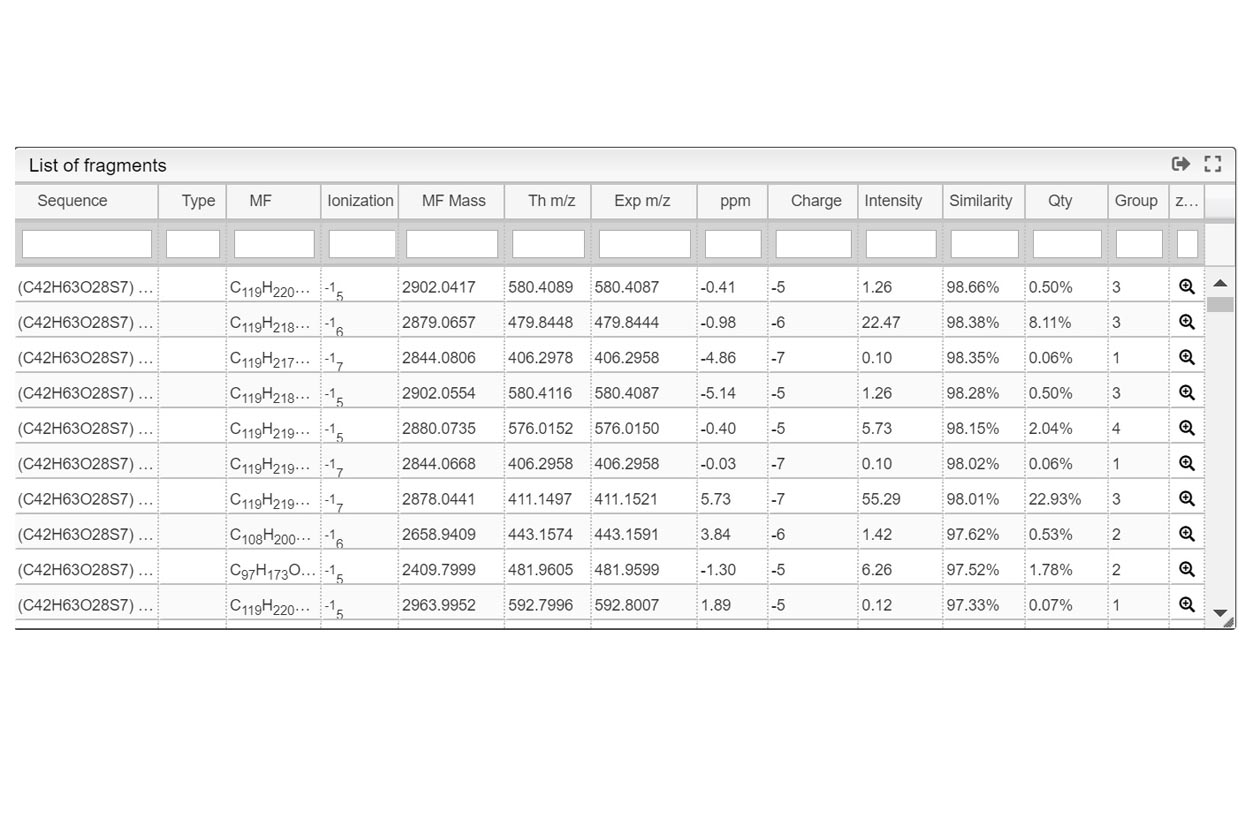
The first view is a summarizing table named List of fragments which contains all the information about the identified molecules. You can see the molecular formula and  ionization form, as well as the Molecular formula monoisotopic peak (without ionization) and the final monoisotopic mass including the charge. Another interesting values such as the ppm error, the relative abundance, the quantity, group and the similarity score are also included in this view. For any of the fragment ions, you can zoom and interact in the mass spectra view (Results 2). All the data presented in the table can be classified by any criterion with a simple click on the column header. You can also use the search bar in order to search faster an individual value or use it by range (go to glossary). You can also export the whole table as text file with Export Data button.

Resuts 2

Mass spectra view

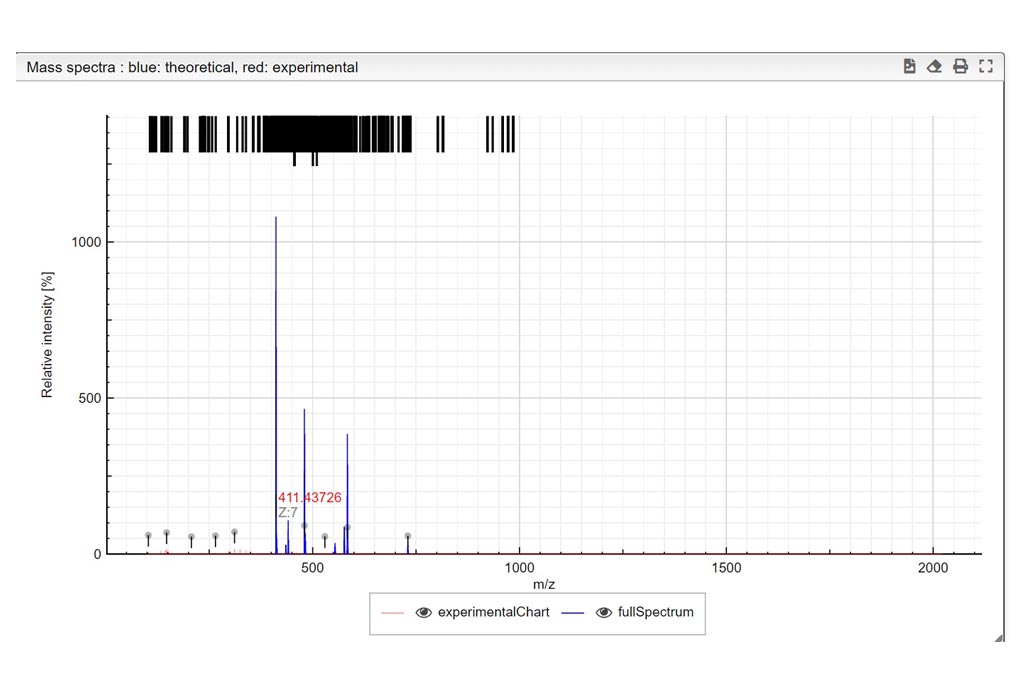
Mass spectra window displays the experimental data (in red) overlaid with the theoretical matched ions (in blue). Identified ions are assigned and black-coded on the top. You can select a single peak in the table view (Results 1) and it is going to be highlighted in this view (in yellow). It is possible to zoom in (left button), zoom out (double left button) and show this window on the full screen (option bar at the top of the window). The content of this window can be either printed or exported as SVG file (option bar). The mixture-sugar example after recalibration is shown in the figure (left).

Resuts 3

Info view

The Info box window shows details for the table-selected ion such as its name, monoisotopic mass, variable groups composition, charge and ionization adduct. you find as well the theoretical monoisotopic mass and the closest m/z experimental data. Below this window, the assigned quantity, the number of distinct fragments found and their percentage of the total intensity are shown. The total amount of theoretically possible fragments based on selected combinations are displayed as well.

Resuts 4

Similarity view

The Similarity box window displays the matching of theoretical isotopic pattern to experimental spectrum for the selected fragment with differences in the intensity of isotopologues highlighted in yellow. You can check our concept of similarity here.

[bsf-info-box icon_type=”custom” icon_img=”id^5079|url^https://ms.epfl.ch/wp-content/uploads/2020/05/equipo-contacta-con-nostros-transparente.png|caption^null|alt^null|title^equipo-contacta-con-nostros-transparente|description^null” img_width=”250″ title=”Do you want to share your results in this page?” heading_tag=”span” pos=”left” title_font_style=”font-weight:bold;” title_font_size=”desktop:22px;” title_font_color=”#333333″]The ISIC-EPFL MS team will be delighted to share your updates in ms.epfl.ch! If you want to describe your project using any of our free tools and share your results, you can publish a post describing the project & results and/or once published we could include in our mstoolbox references page. You can also share any of your learning materials contact us. In any case, If you want to be updated, follow us in twitter or linkedln.[/bsf-info-box]