This tool allows to retrieve the exact composition based on a complex mass spectrum when many signals overlap. This tool was recently used by Prof Dyson et al  to determine the relative strengths of the ion pair binding for a series of Cl salts by ESI-MS. During the experiments the salts aggregate into clusters, the magnitude of which depends on the binding energies and sample concentrations. This application was used to deconvolute the signals and found to be crucial to retrieve the relative amount of each Cl salt in the complex mixture. All the calculations applied during data treatment are performed locally in the browser, with no data transferred and stored on servers.
app-7
Find our day-to-day routine applications
Details
icono-1
Determine the exact composition of complex mixtures with overlapping ions and charge states
Details
app-index-app2
Find out another MS applications
Details

How to use Mass spectra deconvolution step by step

When trying to deconvolute a mass spectrum it is required to define all molecular formula expected to be present. Nevertheless it is important to limit as much as possible the number of molecular formula to consider for calculation time reasons.

STEP 1

Importing Experimental data

This tool can be either used in a LIMS or stand-alone. In the stand-alone mode you should either drag/drop your experimental spectrum as a tab-delimited text file or copy paste it (CTRL-V) while moving you mouse over the drop zone. The list of available spectra will be displayed in the table and you may click on one of them to display it.

STEP 2 (Automatic)

Make a peak picking (centroids) of the mass spectrum

When loading the spectrum a peak picking is done that determine the position and width of all the peaks based on global spectrum deconvolution algorithm that was implemented in JavaScript.

The result of the peak picking appears in the spectrum as yellow vertical lines. Note that the top of the peak is determined based on the 3 highest point and does not have to match an experimental point.

STEP 3

Define possible molecular formulas (Required)

When trying to deconvolute a mass spectrum it is required to define all the possible molecular formula. It is important to limit as much as possible the number of molecular formula to consider.

The molecular formula is defined based on:

  • Base Molecular formula: atoms that are common and present in all the molecular formula
  • Modifications: list of modifications that can be applied on the base MF
    • If you want to search for isotopic enrichment you can enter as MF: C-1[13C], a modification in which we remove a C of natural abundance and add a 13C
  • Ionizations: define the list of ways to ionize the molecule. If the molecule is naturally charted this field may stay empty. It can also contain an unlimited comma separated list of ionizations like Na+, K+, NH4, H+. Importantly, a coma at the end allows no charge/ionization.
    .

In the Picture we show the parameters of the Ionic liquid demo

STEP 4

Molecular Formula filtering (Optional)

Possible MFs can be filtered based on DBE (double bond equivalent, unsaturation), charge and molecular weight. It is also possible to add more advanced filtering option by entering a JavaScript code that can use the following variables:

  • mm: monoisotopic mass of the non ionized molecule
  • mz: observed mass (m/z)
  • charge: charge of the non ionized molecule
  • unsaturation: unsaturation of the non ionized molecule
  • atoms.O, atoms.C, atoms.N, … number of atoms of the non ionized molecule
  • examples:
    • atoms.O < atoms.C
    • mm < 500 && atoms.C > 10

STEP 5

Mass spectrum parameters (Required)

In order to improve the isotopic profile matching between theoretical and experimental data a few parameters should be properly set here. First, we have to set the authorized experimental mass error in ppm (typically <5 for Orbitrap). Secondly, Peak width calculation is done automatically and allows to predict the peak width based on the mass and lastly we authorized experimental relative peak intensity threshold (typically between 0.01-0.1).

In figure we show the ionic liquid example.

STEP 6

Custom MFs (Optional)

Add any other Custom MFs by a comma. They will be ionized as the ionization parameters aforementioned. Only charged molecules are displayed.

Step 7

Run the analysis

Analyze the data by clicking the button. The analysis should finish in a few seconds.

Results in Mass Spectra Deconvolution

Results 1

Reconstruction of the spectrum based on the results

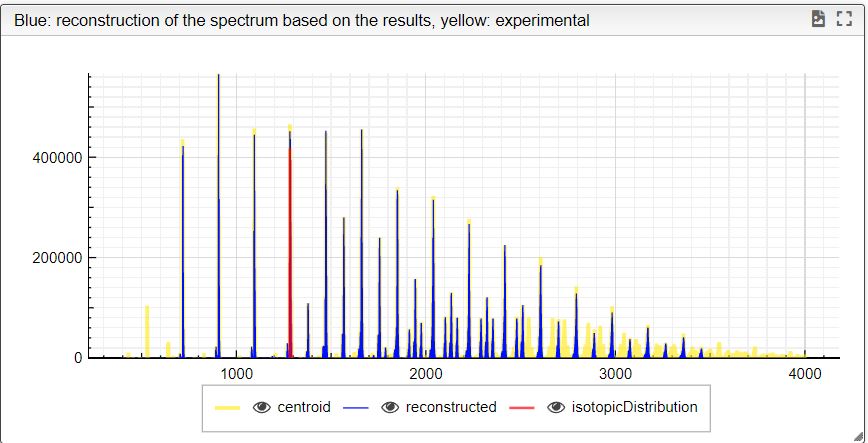
Mass spectra window displays the experimental data (in yellow) overlaid with the reconstructed normalized matched ions (in blue). We can select a single ion in the table view and it is going to be highlighted in this view (in red). It is possible to zoom in (left button), -zoom out (double left button) and show this window on the full screen (option bar at the top of the window). The content of this window can be either printed or exported as SVG file (option bar). The ionic liquid example is shown in the figure (left).

Resuts 2

List of various species

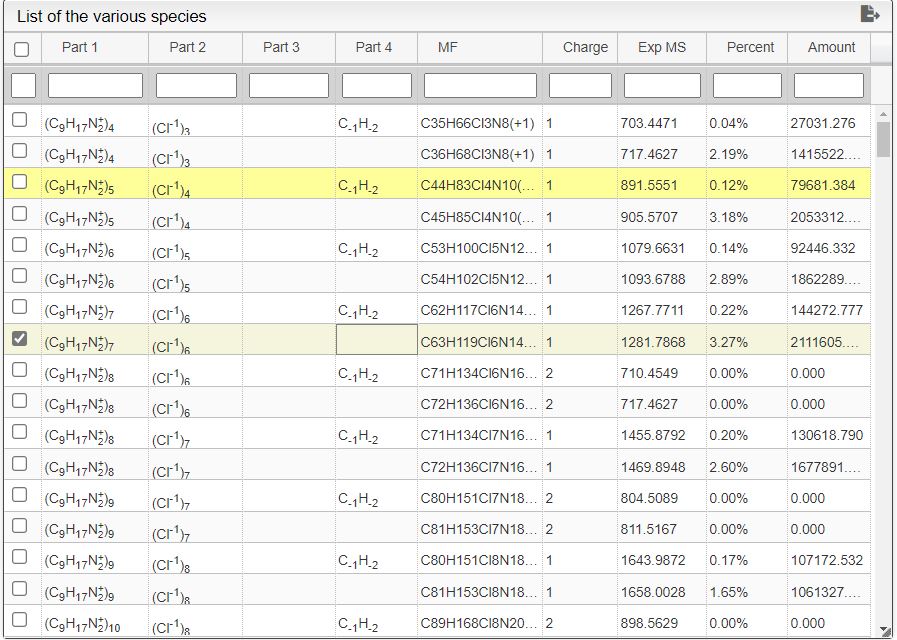
The view is a summarizing table named List of the various species. It contains all the information about the identified ions. You can see the molecular formula, its ionization form, the modifications, the charge and the Experimental MS. Important values such as Percent (in %) and the Amount (total intensity) are also included in this view. For any of the ions, you can zoom and interact in the mass spectra view (Results 1). All the data presented in the table can be classified by any criterion with a simple click on the column header. You can also use the search bar in order to search faster an individual value or use it by range. You can also export the whole table as text file with Export Data button. The data showed in the left represent the ionic liquid example available from List of experimental spectra.

Resuts 3

Info view

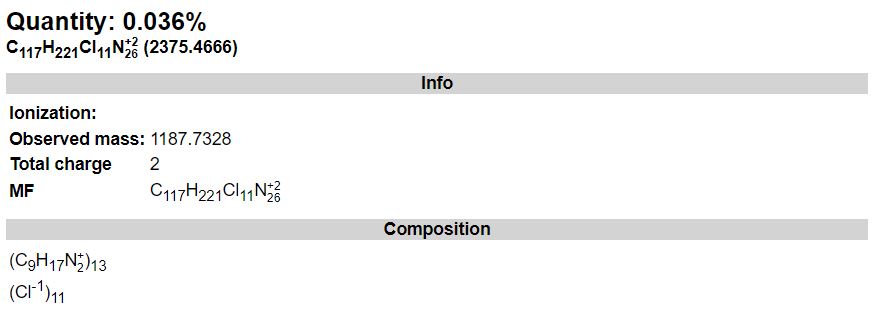
The Info box window shows details for the table-selected ion such as its name, monoisotopic mass, molecular formula, composition and charge. The quantity expressed in % of the total identified peaks is also given

null
Do you want to share your results in this page?
The ISIC-EPFL MS team will be delighted to share your updates in ms.epfl.ch! If you want to describe your project using any of our free tools and share your results, you can publish a post describing the project & results and/or once published we could include in our mstoolbox references page. You can also share any of your learning materials contact us. In any case, If you want to be updated, follow us in twitter or linkedln.