



app-7
Generate the Molecular formula or isotopic distribution of any molecule here.
Details
Recurso 3@2x
automated interpretation of high-resolution glycan MS/MS data.
Details
app-index-app2
Find other open access applications for mass spectra interpretation.
Details

User Guide

for the Aga2S software

1. Build your glycan
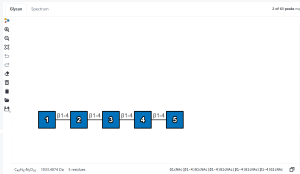
The glycan editor provides an interactive environment to build, modify and inspect glycan structures using standard SNFG notation. Glycans can be created residue by residue directly on the canvas, or generated from an existing glycan sequence. Structural information is updated dynamically while the glycan is being built.

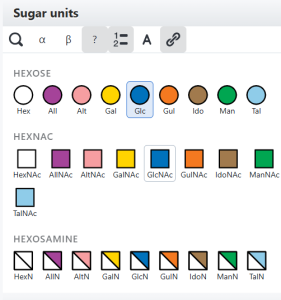
Select a monosaccharide

The Sugar units panel contains a comprehensive collection of monosaccharides organized by residue family, including hexoses, HexNAcs, hexosamines, hexuronates, deoxyhexoses, pentoses, ketoses, sialic acids and other less common residues. Simply click on a residue to select it. The currently selected monosaccharide is highlighted and becomes immediately available for insertion into the structure. The search tool can also be used to quickly locate a specific residue in the library. Before adding a residue, its configuration can be defined directly from the toolbar. This allows the anomeric configuration (α or β) and other structural parameters to be selected while building the glycan, rather than editing the structure afterwards.
Start building the glycan and define anomericity and linkage position

To start a new structure, select the desired monosaccharide and place it on the empty canvas. This first residue defines the starting point of the glycan structure. Once the first residue is present, additional monosaccharides can be connected directly to the existing structure. Select the next residue from the Sugar units panel and choose the position at which it should be attached. The editor automatically creates the glycosidic bond and updates the graphical representation. There is therefore no need to manually draw bonds or reposition each residue after insertion. The glycosidic linkage can be defined directly while the structure is being constructed. The anomeric configuration can be set to α or β, while the appropriate linkage position can be selected according to the glycan being drawn. This makes it possible to construct a fully defined glycan directly from the editor, including both residue identity and connectivity. When structural information is unknown or does not need to be specified, undefined parameters can also be retained. Because these parameters remain editable, a linkage does not need to be deleted and recreated simply to change its configuration or position.

Build branched structures

Branches are created in the same way as linear extensions. Select the residue to add and attach it to the appropriate position of an existing monosaccharide. The editor automatically organizes the resulting structure and updates its graphical layout as new branches are introduced. This allows even relatively complex branched glycans to be constructed without manually arranging every residue on the canvas. The structure can therefore be progressively expanded and modified while maintaining a clear SNFG representation.

Modify an existing structure

A glycan does not need to be rebuilt when a structural parameter has to be changed. Existing residues and linkages can be selected and modified directly in the editor. Residue identity, anomeric configuration and linkage information can therefore be adjusted during the construction process. The graphical structure is updated on the fly after each modification. Residues or branches can also be removed when required, and editing operations can be undone or redone. This makes it easy to explore alternative structures starting from the same glycan.

Create a glycan from a sequence

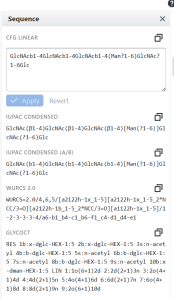
Glycans do not always need to be drawn manually. An existing glycan sequence can be entered into the corresponding sequence field and converted into a graphical structure. The editor interprets the sequence and automatically generates the corresponding glycan representation on the canvas. This provides a fast way to work with structures already available in textual form and also makes it easy to move between sequence-based and graphical representations. Conversely, the sequence corresponding to a structure built in the editor can be retrieved directly from the current glycan.
Inspect and Export the glycan

As the structure is created or modified, Aga²S can provide additional information derived from the current glycan. The composition and molecular information are updated from the structure, allowing the user to inspect the glycan without leaving the editor. The structure can also be connected to external glycan resources through GlyTouCan/GlyCosmos lookup functionality, providing a link between the glycan drawn in Aga²S and established glycan databases. Once the structure is complete, it can be reused outside Aga²S. Graphical representations can be exported for figures or documentation, while structural and sequence-based formats allow the glycan to be transferred to other applications. Available outputs include graphical formats such as PNG and SVG, together with molecular or sequence representations such as SMILES and glycan sequences. The glycan editor can therefore be used independently as a convenient structure-building tool, as well as the starting point for subsequent MS and MS/MS analysis in Aga²S.
2. Fragmentation and MS/MS setup

Once the glycan structure has been defined, Aga²S can generate its theoretical fragments and compare them with experimental mass spectrometry data. Experimental spectra can be imported directly into the application, while ionization conditions, charge states and fragmentation rules can be adjusted to reproduce the experimental setup.

Import experimental MS data

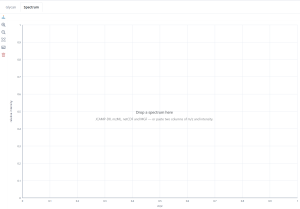
Experimental mass spectra can be loaded directly into Aga²S from the Spectrum tab. Simply drag and drop a spectrum onto the empty spectrum window. Aga²S supports common MS formats including JCAMP-DX, mzML, netCDF and MGF.  Alternatively, a processed spectrum can be imported without creating a file: copy and paste two columns containing m/z and intensity values directly into the spectrum window. Once loaded, the spectrum is immediately displayed and ready for interactive exploration and subsequent MS/MS analysis.

Explore the experimental spectrum

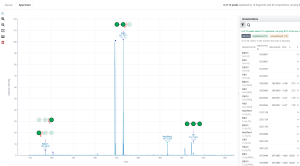
Once imported, the experimental MS/MS spectrum is displayed in the interactive Spectrum view. Users can zoom and navigate through the spectrum to inspect individual signals and focus on specific m/z regions. The spectrum remains directly connected to the structural information generated by Aga²S. Peaks can display their associated fragment structures and calculated information, providing an immediate visual link between the experimental MS/MS data and the glycan fragmentation. A summary at the top of the interface gives a rapid overview of the fraction of experimental peaks currently explained.

Define ionization, charge states and fragmentation rules

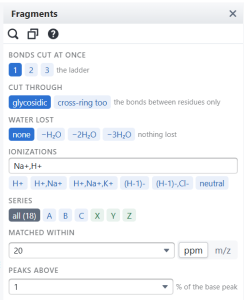
Before generating theoretical fragments, select the ionization conditions corresponding to the experiment. Aga²S allows the ionization/adduct conditions and charge states to be defined directly in the fragmentation parameters. Several charge states or ion forms can be considered when required. The theoretical m/z values generated by Aga²S are automatically recalculated according to the selected conditions, allowing the same glycan to be explored under different experimental configurations without rebuilding the structure. The fragmentation model can be adapted to the type of structural information required. Glycosidic cleavages can be generated as B, C, Y and Z ions, while A and X ions provide access to cross-ring fragmentation. The desired fragment series can be activated or deactivated independently. This allows the theoretical fragment population to be restricted to the fragmentation pathways relevant to a particular experiment. Aga²S generates the corresponding theoretical fragments directly from the glycan structure, retaining the relationship between each calculated mass and the structural cleavage that produced it. Aga²S can consider more than a single cleavage when generating theoretical fragments. The number of bonds that may be cut simultaneously can be adjusted in the fragmentation settings. Increasing this value allows the generation of more complex fragments, including products resulting from multiple cleavage events. This considerably expands the theoretical fragment space and can help explain signals that cannot be assigned using simple single-bond fragmentation. Because the number of possible fragments increases rapidly with fragmentation depth, this parameter can also be used to control the complexity of the calculation.

Generate theoretical fragments

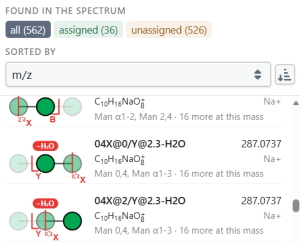
Once the fragmentation parameters are defined, Aga²S generates the corresponding theoretical fragments on the fly. The fragment list can be filtered according to whether a theoretical fragment is assigned to an experimental peak or remains unassigned, and results can be sorted by m/z. Each entry keeps the structural information associated with the fragmentation pathway, including the fragment drawing, ion type, elemental composition, ionization and theoretical m/z. When several different fragments share the same mass, Aga²S retains the alternative assignments rather than forcing a single interpretation.

3. Results and MS/MS annotation

Once theoretical fragments have been generated, Aga²S automatically compares them with the experimental MS/MS spectrum. Matching fragments are assigned to experimental peaks, providing an interactive overview of the signals that can be explained by the proposed glycan structure. Results can then be explored directly from the spectrum or through the annotation panel, where individual assignments and their associated mass information can be inspected in detail.

Visualize the origin of a fragment

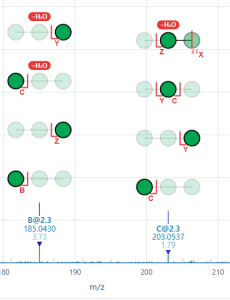
Theoretical fragments can be visualized directly above the experimental spectrum, providing an immediate graphical representation of the possible cleavage pathways associated with each m/z region. For matched peaks, Aga²S displays the assigned ion series, theoretical m/z and mass error together with the corresponding fragment structures. Multiple structural candidates can be displayed for the same experimental region, making alternative or ambiguous fragmentation pathways directly visible.

Explore the annotation results assess the overall annotation coverage

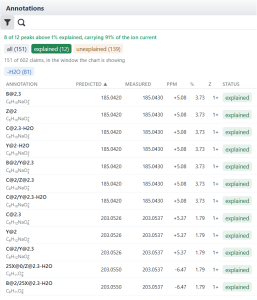
The Annotations panel provides a detailed overview of the matches between theoretical fragments and experimental peaks. Results can be displayed together or filtered to show only explained or unexplained signals, making it easy to identify both successful assignments and regions that remain unassigned. For each explained peak, Aga²S reports the predicted and measured m/z, mass error in ppm, relative intensity and charge state. Selecting an entry connects the numerical result with the corresponding peak in the spectrum, allowing individual assignments to be inspected interactively. Aga²S continuously summarizes how much of the experimental spectrum is explained by the current glycan and fragmentation settings. Two complementary values are reported: the number of experimental peaks that have been explained and the percentage of the total ion current represented by those peaks. These values provide a rapid indication of annotation coverage while avoiding reliance on peak count alone: a few intense assigned peaks may account for a substantial fraction of the experimental signal, whereas numerous low-intensity assignments may contribute relatively little to the total ion current.

Inspect individual assignments and explore explained and unexplained peaks

Individual annotations can be explored interactively to connect the numerical result with the corresponding experimental signal and theoretical fragment. Predicted and measured m/z values can be compared directly, together with the associated mass error, intensity and charge. This interactive connection between spectrum, annotation and fragment structure facilitates the inspection of individual assignments without having to compare separate tables or manually search for the corresponding peak.The annotation results can be filtered according to their assignment status. Switching between all, explained and unexplained peaks provides a rapid way to focus either on successfully annotated signals or on experimental peaks that are not accounted for by the current fragmentation model. Unexplained peaks are deliberately retained rather than discarded. They can therefore be used to identify missing fragmentation pathways, alternative structures or experimental signals that require further investigation.

Handle ambiguous assignments

A single experimental m/z may be compatible with more than one theoretical fragment. Aga²S preserves these alternative assignments rather than automatically selecting one candidate. Mass-sharing fragments and alternative cleavage pathways can therefore be inspected explicitly, with their corresponding structures displayed alongside the experimental signal. This makes genuine structural ambiguity visible to the user instead of hiding it behind a single proposed assignment.

Filter and refine the results

Results can be progressively refined using the available filtering and selection tools. This allows the user to reduce the displayed fragment population and focus on the assignments most relevant to the analysis. Because theoretical fragments are generated and matched on the fly, changes to fragmentation parameters, mass tolerance or peak-selection criteria are rapidly reflected in the results. Different fragmentation hypotheses can therefore be explored interactively without rebuilding the glycan or restarting the analysis.

From spectrum to structural interpretation

Together, the spectrum viewer, theoretical fragment list and annotation panel provide complementary views of the same analysis. Experimental peaks can be related directly to calculated masses, fragmentation pathways and the corresponding portions of the original glycan structure. Aga²S therefore keeps the experimental evidence and its structural interpretation connected throughout the analysis, while leaving alternative and unexplained assignments visible for further investigation.

null
Do you want to share your results in this page?
The ISIC-EPFL MS team will be delighted to share your updates in ms.epfl.ch! If you want to describe your project using any of our free tools and share your results, you can publish a post describing the project & results and/or once published we could include in our mstoolbox references page. You can also share any of your learning materials contact us. In any case, If you want to be updated, follow us in twitter or linkedln.